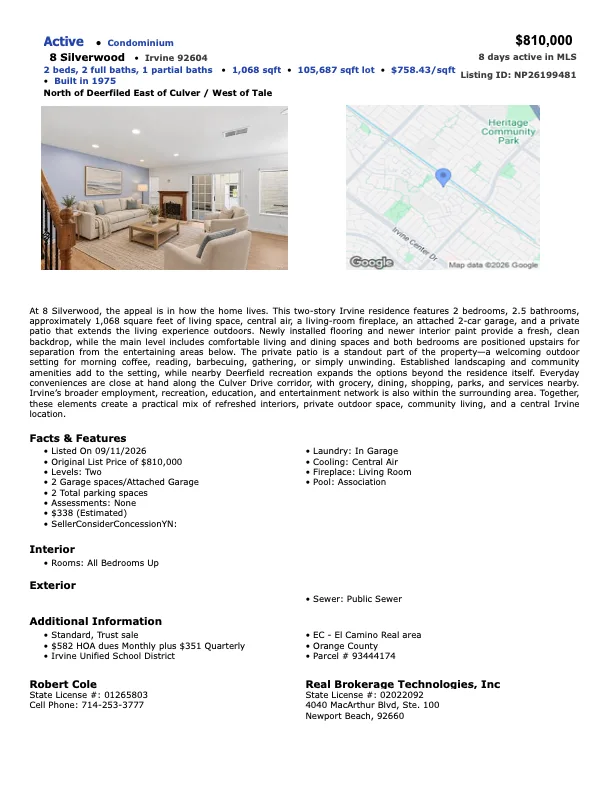
Interactive Presentation • Mortgage Coach
Seller Strategy & Financing Review
Review potential pricing adjustments, seller concessions, and financing scenarios to see how different strategies may affect buyer costs and estimated seller proceeds.
Seller advisory · 8 Silverwood, Irvine, CA 92604
Reporting period: October 12–18, 2026. This week's update reviews continued marketing exposure, buyer engagement, competitive market conditions, and the mortgage environment for 8 Silverwood. While the property continued receiving meaningful visibility, the distinction between exposure and actual buyer activity remains important. The sections below provide the supporting information and my perspective on what we're observing and the decisions ahead.
01 WEEK 4 AT A GLANCE
Week 4 Seller Update · October 12–18, 2026
At 32 days on market, 8 Silverwood remains well within the estimated 161-day market time for its comparable Irvine attached-home segment. That benchmark provides perspective on the slower pace of today's market, although it does not predict when an individual property will sell.
During Week 4, the property received one private showing on October 15, with no additional independent agent inquiries or formal showing feedback recorded. Marketing exposure continued to grow, but the limited number of showings indicates that visibility has not yet converted into sustained buyer engagement.
Mortgage financing and total monthly ownership costs remain important considerations. Although the property is still relatively early in its marketing period compared with competing listings, the response so far supports a closer evaluation of how price, financing incentives, and the property's overall financial positioning may influence the next stage of buyer activity.
WEEKLY PERSPECTIVE
Week 4 · October 12–18, 2026
Rob's perspective on this week's marketing exposure, buyer response, competitive conditions, and what the current evidence means for 8 Silverwood, Irvine.
Asking Price
$810,000
Days on Market
32 days
Comparable Segment Market Time
161 days
Estimated market time (EMT)
Listing Age / Market Time
19.9%
Current days on market relative to comparable-segment EMT.
Estimated Market Time is calculated from 59 active comparable listings and 11 properties entering contract during the preceding 30-day period. The 19.9% figure compares 8 Silverwood's current listing age against this estimated market-time benchmark. It is not a measure of sale progress.
September 17–October 20, 2026
Starting
Rate
Monthly Payment
6.95%
$5,717
Current
Rate
Monthly Payment
7.25%
$5,849
Payment Change
Monthly Payment Increase
+$131
Based on 20% down at the $810,000 asking price. Payments include principal, interest, property taxes and HOA dues. Homeowners insurance is excluded. Mortgage rates are illustrative national averages.
Strategy & Options Review
The following decision tools are designed to help evaluate possible next steps, financing considerations, and how today’s market differs from the environment in which recent comparable sales closed.
Interactive Presentation • Mortgage Coach
Review potential pricing adjustments, seller concessions, and financing scenarios to see how different strategies may affect buyer costs and estimated seller proceeds.
Interactive Presentation • Mortgage Coach
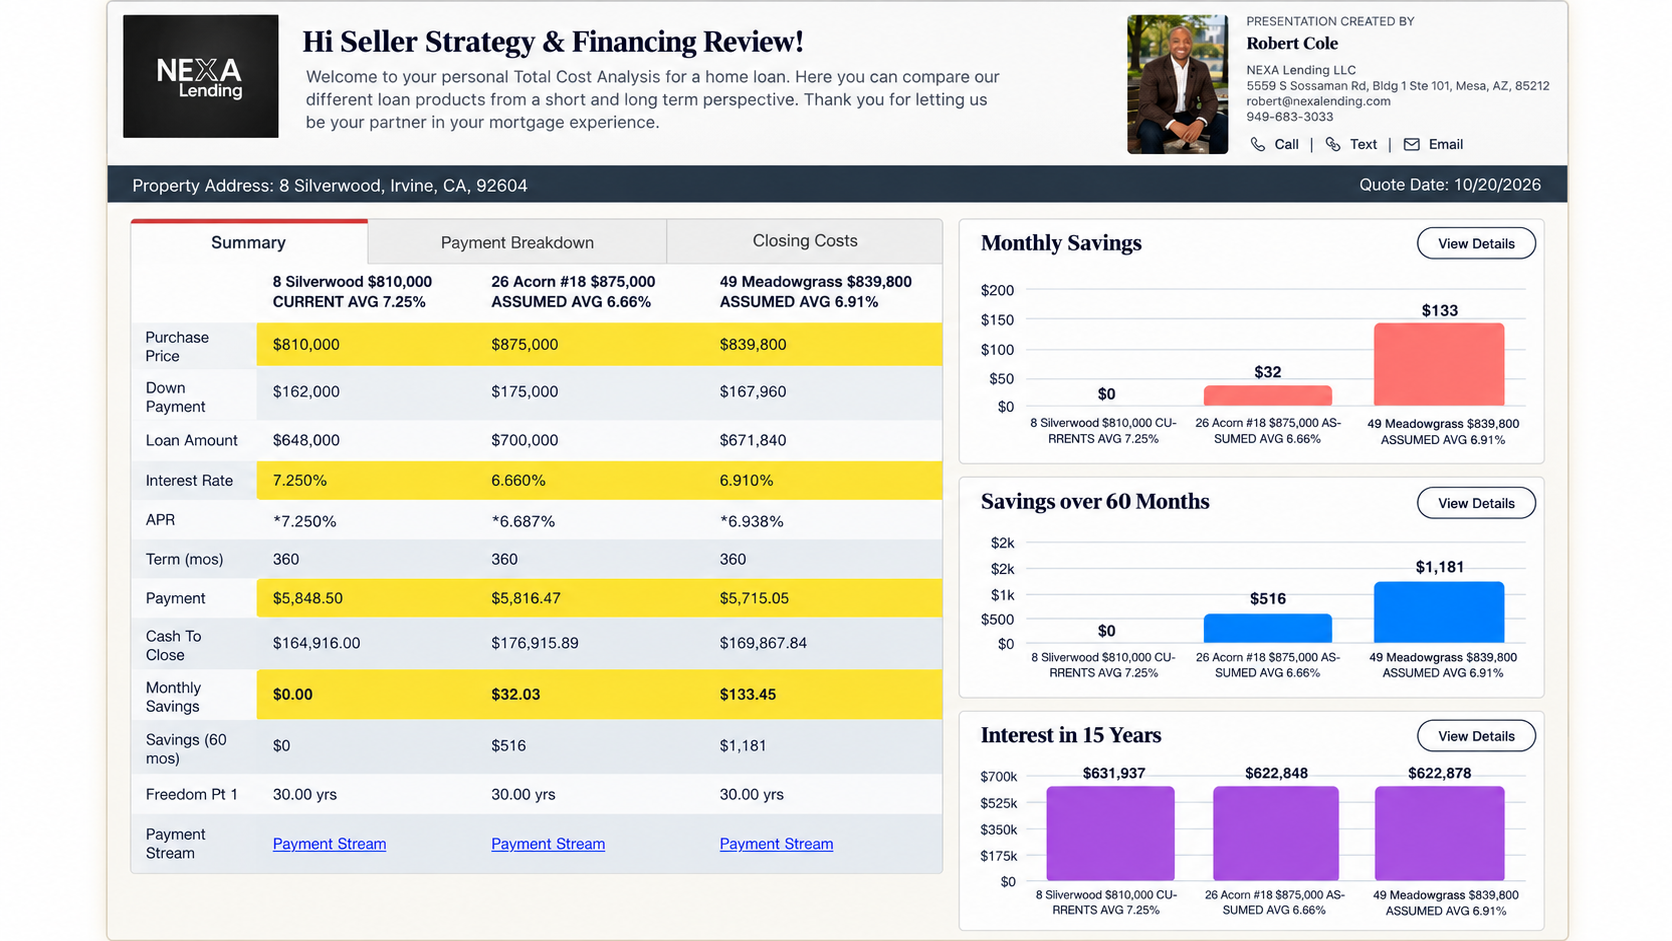
Compare 8 Silverwood with recent relevant sales and competitive alternatives to illustrate how rates, HOA dues, and total ownership costs may shape buyer decisions in today’s market.
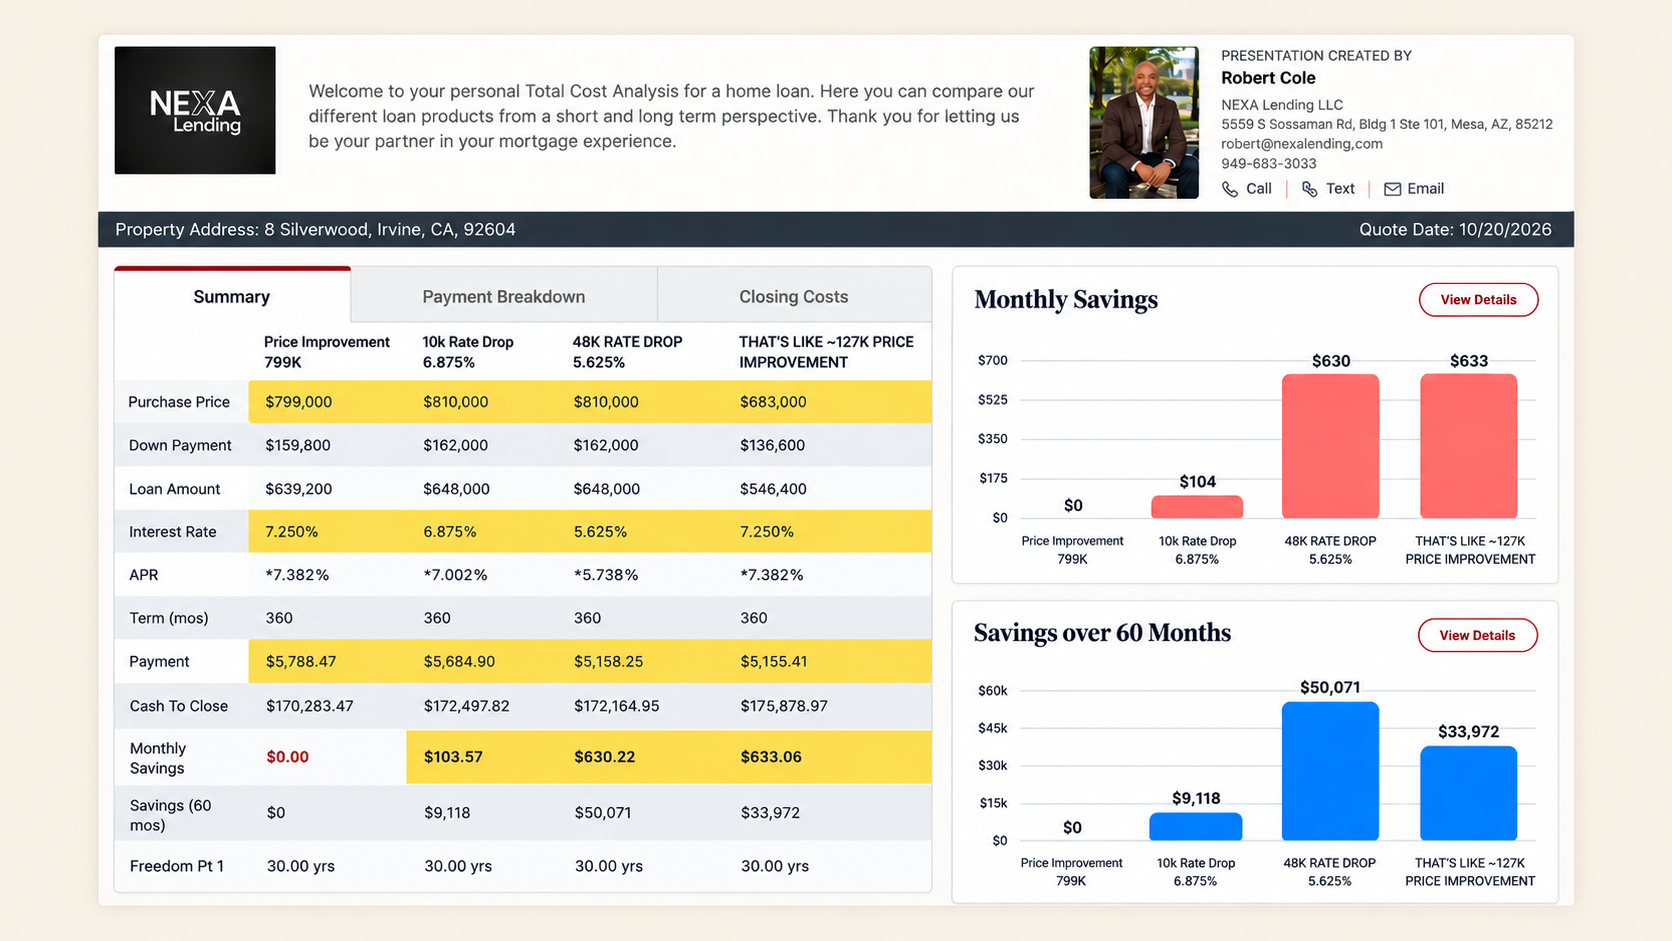
Compare potential price improvements and their illustrative effect on a buyer’s monthly payment. These figures are intended to support discussion and evaluation. No price adjustment has been approved.
Baseline · Current Asking Price
Current Asking Price
$810,000
Estimated Monthly Payment
$5,849
Price Improvement 1
$798,000
Seller Concession Comparison
$10,000 buydown at 6.875% → $5,685/mo
+$38/mo savings vs this price improvement
Reduction from $810,000 asking
-$12,000
Est. Monthly Payment
$5,783
Est. Monthly Savings
$66/month
Price Improvement 2
$788,000
Reduction from $810,000 asking
-$22,000
Est. Monthly Payment
$5,728
Est. Monthly Savings
$121/month
Price Improvement 3
$768,000
Reduction from $810,000 asking
-$42,000
Est. Monthly Payment
$5,619
Est. Monthly Savings
$230/month
Price Improvement 4
Maximum Adjustment
$758,000
Seller Concession Comparison
$48,000 buydown at 5.625% → $5,158/mo
+$346/mo savings vs this price improvement
Reduction from $810,000 asking
-$52,000
Est. Monthly Payment
$5,565
Est. Monthly Savings
$284/month
Illustrative payment calculations based on a 7.25% 30-year fixed mortgage, 20% down, $729 monthly property taxes, and $699 monthly HOA dues. Homeowners insurance is excluded. Actual property taxes, mortgage rates, loan terms, and financing costs may vary. No price adjustment has been approved.

Reports on Housing — Steven Thomas
An educational discussion of condominium financing requirements, HOA financial considerations, insurance, reserves, and how lending standards may affect the condominium market and buyer financing options.
8 Silverwood Journal
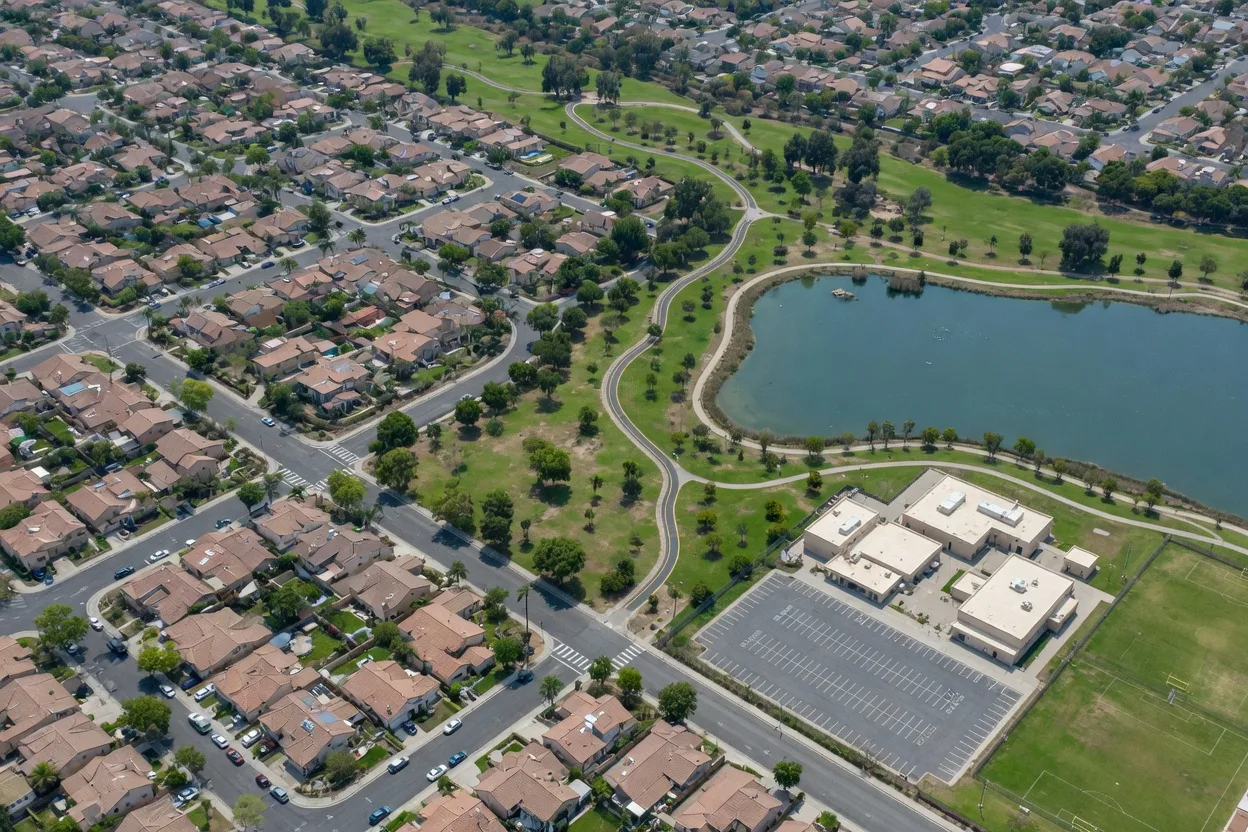
An educational overview of how condominium financing can depend on both borrower qualification and the financial condition, insurance, reserves, and other requirements of the condominium association.
02 Listing & Marketing Activity
Week 4 Seller Update · October 12–18, 2026
October 12–18, 2026
The existing Meta advertising campaign was paused during the reporting period after establishing substantial paid exposure for 8 Silverwood across Facebook and Instagram. The campaign remains inactive while the listing strategy is evaluated.
October 12–18, 2026
Continued discussing 8 Silverwood through personal network conversations and direct outreach during the reporting period, maintaining awareness of the property beyond its online marketing channels.
03 Marketing & Exposure
Week 4 Seller Update · October 12–18, 2026
54,330+
CUMULATIVE DOCUMENTED EXPOSURE
September 17–October 18, 2026
Combined reported marketing exposure from the beginning of the listing launch through the Week 4 reporting period. This is not a Week 4-only total.
Week 4 interpretation to be added once the finalized exposure data is supplied.
This is a combined, gross, non-unique reported marketing exposure total. Figures may overlap across platforms and do not represent unique individuals or a deduplicated audience. Zillow views represent a rolling 30-day snapshot rather than a since-launch total.
3,502
Emails Delivered
1,878
Emails Opened
54%
Open Rate
5 Miles
Target Radius
Target ZIP: 92604
The October 2 campaign promoted the October 3 open house to local real estate recipients within a 5-mile radius of 92604. These results reflect a previously completed campaign. No additional MLSBlast promotion was conducted during the October 12–18 reporting period.
View MLSBlast CampaignCumulative MLSBlast Outreach — Since Launch
3
Campaigns
10,006
Emails Delivered
5,348
Reported Opens
53.4%
Blended Reported Open Rate
These cumulative figures are based on three verified MLSBlast campaigns: Initial Agent Introduction (4,002 delivered / 2,118 reported opens); Launch / Open House Promotion (2,502 delivered / 1,352 reported opens); Week 2 Open House Promotion (3,502 delivered / 1,878 reported opens).
Since launch, three MLSBlast campaigns have supported agent awareness and open-house promotion for 8 Silverwood.
MLSBlast Results
Verified MLSBlast activity report. Click to view.
MLSBlast Activity Report · October 2, 2026
Campaign date: October 2, 2026
Performance reporting through: October 9, 2026
Promoted event: October 3 open house
Source: MLSBlast Activity Report
522
Agent Views
247
Auto Email Matches
212
Client Portals
63
Client Views
1
Favorites
CRMLS Matrix activity provides a view of how the listing is being seen and engaged with inside the MLS and its connected client-search environment. These values are dynamic and are reported as the current verified exposure snapshot.
CRMLS Listing Record
Live MLS listing for 8 Silverwood — click to view.
Source: CRMLS Matrix Hit Counters
Current verified exposure snapshot; Matrix values can be dynamic.
2,987
Total Views
2,895
Consumer Views
92
Agent Views
2,806
Property Search Page
68
Email Exposure
15
Property Detail Page
7
Agent Profile
5
Multiple Listings
4
Homepage
Homes.com reports 2,987 total views since the listing was published, with 2,895 consumer views and 92 agent views. These figures are the cumulative listing-activity snapshot since listed.
Homes.com defines "Total Views" as listing impressions generated across its traffic sources. "Property Detail Page" represents openings of the property detail page.
Homes.com Source Snapshot
Current Homes.com listing analytics. Click to view.
Homes.com Listing Analytics · Since Listed / cumulative snapshot
Source: Homes.com Listing Analytics
Context: Since Listed / cumulative snapshot
583
Views
33
Saves
Zillow reports 583 views and 33 saves in its current "Last 30 Days" listing-traffic window.
Source period: Latest available 30-day Zillow snapshot. These figures are not confirmed unique visitors or confirmed since-launch totals.
Compared with the previous snapshot, views decreased by 96 and saves decreased by 8.
These figures compare two rolling 30-day snapshots, not separate weekly activity totals.
Zillow Source Snapshot
Current Zillow listing activity. Click to view.
Zillow Listing Activity · Last 30 Days
Source: Zillow Listing Activity
Context: Last 30 Days
Facebook + Instagram
October 12–18, 2026
1,000
Impressions
972
Reach
75
Landing-Page Views
36,431
Impressions
26,337
Reach
2,743
Landing-Page Views
Campaign Launch: September 24, 2026
Destination: 8Silverwood.com
The Meta advertising campaign was paused during Week 4. The campaign's cumulative results remain documented as part of the property's marketing history.
Platform: Meta — Facebook + Instagram
Campaign objective: Website traffic / Landing Page Views
Advertising category: Housing
Primary reporting period: October 12–18, 2026
Campaign to date: September 24–October 18, 2026
Source: Meta Ads Manager
Week 4 figures reflect activity attributed to the October 12–18 reporting period. Campaign-to-date figures represent the recorded results since launch. Impressions, reach, and landing page views are different reporting measures and should not be interpreted as equivalent or as unique buyer inquiries.
Status: PAUSED / OFF
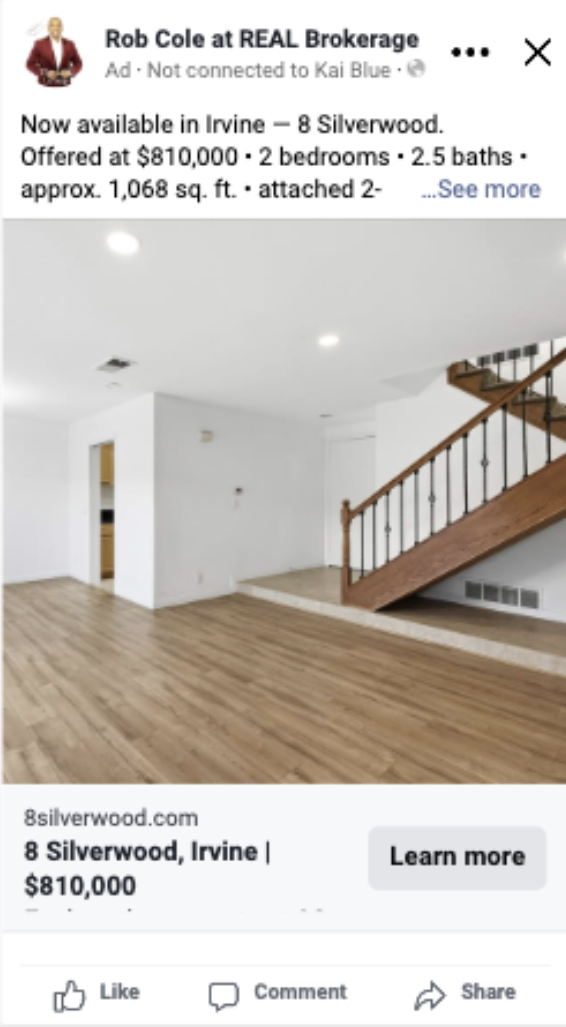
Creative shown for seller reference. The campaign is currently paused; verified campaign performance is reported separately above.
Supporting channel
Website traffic is reported as measured engagement on 8Silverwood.com and is not interpreted as buyer activity.
Week 4 · October 12–18, 2026
307
Website Page Views
142
Active Users
182
Sessions
50
Engaged Sessions
27.47%
Engagement Rate
864
Recorded Events
Campaign to Date · September 24–October 18, 2026
3,389
Sessions
3,173
Active Users
3,801
Page Views
Traffic Attribution
84
Sessions from Meta Paid Social
84 of the 182 website sessions during the October 12–18 reporting period were attributed to Meta paid social.
Direct: 98 sessions
Meta Paid Social: 84 sessions
Unassigned: 1 reported session
GA4 engagement metrics
Direct: 38 engaged sessions · 38.78% engagement rate
Meta Paid Social: 12 engaged sessions · 14.29% engagement rate
Page Views by Page · October 12–18, 2026
Homepage 151; Seller Updates 65; Market Intelligence 28; Gallery 19; Documents 16; Neighborhood 14; Blog 6; About 4; Week 1 Seller Update 2; Day Around 8 Silverwood Article 1.
Google Analytics records measured website activity, including page views, sessions, engagement, and events. These figures do not establish confirmed buyer inquiries, showing requests, or offers.
Additional verified information: New Users 136; Recorded Events 864; Key Events 11. The 11 key events are not interpreted as 11 buyer leads or 11 completed inquiries.
GA4 Visitor Geography
Week 4 visitor geography for 8Silverwood.com, reporting period October 12–18, 2026. Visitor geography is reported as measured website engagement and is not interpreted as buyer activity.
Google Analytics 4 | October 12–18, 2026
Primary reporting period: October 12–18, 2026
Campaign to date: September 24–October 18, 2026
Source: Google Analytics 4
September 24–October 18, 2026
Irvine represented 19.10% of active website users during the reporting period.
Website traffic during the campaign-to-date reporting period remained concentrated across Orange County and the broader Southern California market, with Irvine representing the largest single city concentration at 19.10% of active users. Other leading markets included Los Angeles, Anaheim, Santa Ana, Lake Forest, Fullerton, Tustin, Costa Mesa, Huntington Beach, and Garden Grove. The pattern shows the property website continuing to reach both the immediate Irvine / Orange County market and a broader Southern California audience.
Google Analytics location data is aggregated and approximate. City activity does not identify individual visitors or indicate confirmed buyer intent.
Figures will be Week 4 activity or each channel's labeled cumulative snapshot and are not combined: MLSBlast, CRMLS Matrix, Zillow, Homes.com, Meta, and the property website measure different types of activity and may include overlapping audiences. Campaign-to-date and cumulative snapshot figures are shown as secondary supporting context. All Week 4 figures are currently placeholders until the finalized reporting data is supplied.
04 Buyer Activity & Feedback
A current view of showings, open-house activity, buyer response and the feedback being received from the market.
Week 4 Seller Update · October 12–18, 2026
1
Completed private showings during Week 4.
Source: ShowingTime
0
No open house conducted during Week 4.
0
No buyer or agent inquiries during Week 4.
0
No new buyer or agent follow-up conversations.
During October 12–18, 8 Silverwood received one private showing, conducted on October 15. No open house was held during the reporting period.
No buyer or agent inquiries were recorded during the week. No buyer or agent follow-up conversations were recorded.
The ShowingTime report documents four cumulative private showing appointments through October 15, including the October 15 Week 4 showing. No formal feedback responses were recorded in the available ShowingTime report.
Previously documented buyer activity and feedback remain part of the listing's cumulative history and are preserved in the supporting report below.
Detailed activity, follow-up and feedback are maintained in a continuing listing record and summarized into a dated report for each seller-update period.
8 Silverwood
Buyer Activity & Feedback Report
Week 4 · Seller Update
Weekly activity October 12–18, 2026
Cumulative showing history September 17–October 15, 2026 (ShowingTime report verification date)
ShowingTime Listing Activity Report
The ShowingTime listing activity report documents four cumulative private showing appointments, including one private showing on October 15 during Week 4. The available report records no formal feedback responses through October 15, 2026.
October 15 Private Showing
October 15, 2026
One private showing was completed on October 15. The available ShowingTime report does not contain a formal feedback response for this appointment.
Facebook HOA Inquiry
October 5–11, 2026 reporting period
Facebook Advertisement · Public Comment
A commenter asked about the property's associated HOA fees.
Response provided: Doe Trail Condo Association: $582/month; Deerfield Community Association: $351/quarter; Combined monthly equivalent: $699.
Outcome: The commenter acknowledged the information with a thumbs-up reaction. No further conversation or showing request followed.
Post-Showing Follow-Up — October 4 Showing
October 4, 2026
Follow-Up Completed · Response Pending
Follow-up was completed with the showing agent after the October 4 private showing. As of the reporting close, a response and buyer feedback had not yet been received.
Showing Feedback — September 26, 12:00 PM Showing
SEPTEMBER 28, 2026
The showing agent followed up regarding the buyers who toured 8 Silverwood on Saturday, September 26 at 12:00 PM. The buyers are international and were comparing approximately 15 properties, including both newer and older homes. They liked 8 Silverwood, but felt the home did not fully match their personal style. The strongest concern they raised was the HOA cost. The agent explained that higher HOA expenses are common in Irvine and shared her own experience with multiple HOA fees, but the buyers remained sensitive to the overall HOA obligation.
Key takeaway: The primary objection from this buyer group was the HOA cost rather than the property itself.
Online Buyer Inquiry — No Response
SEPTEMBER 23, 2026
A buyer reached out online regarding 8 Silverwood. Rob responded to the inquiry, but no further response or showing request had been received as of the close of the reporting period.
Price Flexibility Inquiry
SEPTEMBER 22, 2026
Following a showing, the agent clarified that he was evaluating the property for himself and asked whether the seller was firm at $810,000 or had flexibility.
This is documented buyer/agent feedback and should not be characterized as an offer or indication that an offer will be submitted.
05 The Market Around 8 Silverwood
A current look at the listings, recent sales and market changes most relevant to 8 Silverwood's competitive position.
Week 4 Seller Update · October 12–18, 2026
Asking Price
$810,000
Days on Market
32
Comparable Expected Market Time
161 days
Listing Age / Expected Market Time
19.9%
Comparable Expected Market Time reflects the defined Irvine attached-home segment. The 19.9% figure compares 8 Silverwood's listing age with that market-time benchmark; it does not represent progress toward a sale.
Competitor Asking Price Range
$699,000–$849,000
Relevant Active Competitors
2
Recent Relevant Sales
2
These figures are the current verified competitive snapshot.
81 Days on Market
$849,000
2 bedrooms · 2.5 bathrooms · 1,068 sq. ft.
$795/sq. ft.
HOA: $640/mo
Currently priced $39,000 above 8 Silverwood.
View in Market Intelligence
93 Days on Market
$699,000
2 bedrooms · 1.5 bathrooms · 1,110 sq. ft.
$630/sq. ft.
HOA: $516/mo
31 Meadowgrass was previously marketed at $749,000, later entered escrow, subsequently fell out of escrow, and has since returned to the market repositioned at $699,000.
View in Market Intelligence
Closed September 18, 2026
18 Days on Market
$875,000
2 bedrooms · 1 bathroom · 1,114 sq. ft.
$785/sq. ft.
HOA: $516/mo
View in Market Intelligence
Closed September 12, 2026
110 Days on Market
$839,800
3 bedrooms · 1 bathroom · 1,220 sq. ft.
$688/sq. ft.
HOA: $516/mo
View in Market Intelligence
31 Meadowgrass
93 Days on Market
Previously repositioned from $749,000 to $699,000 and returned to market after falling out of escrow.
13 Sunflower
110 Days on Market
Most recent asking price: $819,900
View in Market Intelligence
These changes affect the competitive environment buyers see when comparing available and recently marketed homes around 8 Silverwood.
8 Silverwood · Current competitive analysis
Updated September 27, 2026 · Week 4 update pending
VIEW DETAILED COMPETITIVE MARKET REPORT VIEW LIVE CMA06 Market Reports & Supporting Research
Week 4 Seller Update · October 12–18, 2026
Broader market reports and source material used to provide additional context for the strategy surrounding 8 Silverwood.
Irvine Attached Properties | September 18–October 18, 2026
Active Comparable Listings
59
59 active comparable Irvine attached properties, with a price ceiling of $1,000,000.
Properties Entering Contract
11
11 comparable properties entered contract between September 18 and October 18, 2026.
Comparable Estimated Market Time
161
Days
Calculated from 59 active comparable listings and 11 properties entering contract during the 30-day reporting window.
This narrower Irvine attached-property segment provides a more relevant estimated market-time benchmark for 8 Silverwood than citywide figures alone.
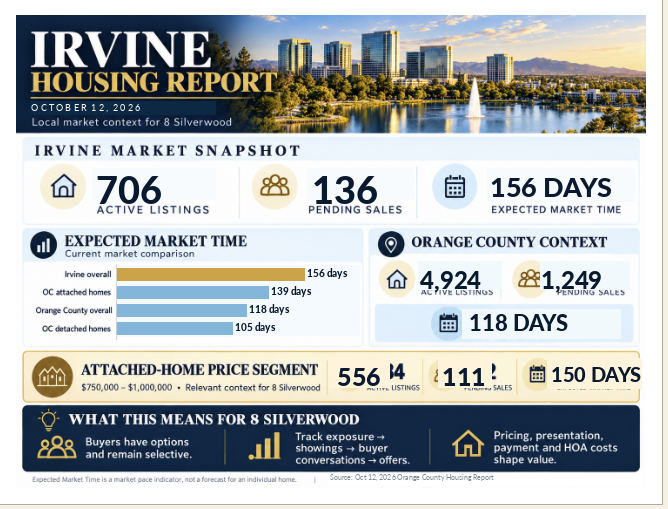
The comparable Irvine attached-property segment currently has an estimated market time of 161 days, compared with 156 days for Irvine overall and 139 days for Orange County attached homes. These figures provide context for the pace of the market surrounding 8 Silverwood. They are market-time estimates, not predictions of when an individual property will sell.
October 12, 2026 · Irvine and Orange County Market Snapshot
Broader Market Context
Orange County Overall
Active Listings
4,924
Pending Sales
1,249
Expected Market Time
118 Days
Housing Type
Detached Homes — 105 Days Expected Market Time; Attached Homes — 139 Days Expected Market Time.
October 12, 2026 Orange County Housing Report
Market reports previously shared with the seller, preserved by date for historical reference and comparison.
September 28, 2026
SHARED WITH SELLER · SEPTEMBER 2026
Irvine market snapshot with Orange County attached-home context for condominium and townhome buyers.
September 14, 2026
Shared with seller · September 2026
Irvine market snapshot with Orange County attached-home context for condominiums and townhomes.
August 31, 2026
Shared with seller · August 2026
Issue 05 · The Season of Selectivity
June 8, 2026
Shared with seller · June 2026
Market snapshot through May 2026
Scroll sideways
07 Mortgage Environment
Week 4 Seller Update · October 12–18, 2026
Mortgage rates remained at the previously reported levels through Friday, October 16, 2026. The latest verified 30-year fixed-rate benchmark remains 7.40%, while the 15-year fixed-rate benchmark remains 6.73%. The affordability calculations for 8 Silverwood therefore remain unchanged from the previous reporting period. These figures continue to provide context for the financing environment facing prospective buyers.
30-Year Fixed · Freddie Mac
30-Year Weekly Change
7.40%
Net change through October 16, 2026: 0.00 percentage points · unchanged from the previous report
15-Year Fixed · Freddie Mac
October 16, 2026 · 6.73% · unchanged from the previous report
0.00 pts
30-Year Fixed · Bankrate
Unchanged through October 16, 2026
0.00 pts
Freddie Mac — Primary Mortgage Market Survey, September 17 through October 16, 2026
Bankrate — National Mortgage Rate Survey, October 16, 2026, compared with the prior week
Freddie Mac and Bankrate figures are national weekly survey averages, not a borrower-specific rate quote. Actual rates and pricing vary by lender, loan program, borrower qualifications, points, and market conditions.
30-Year Fixed
7.40%
Source: Freddie Mac · October 16, 2026
15-Year Fixed
6.73%
Source: Freddie Mac · October 16, 2026
FHA 30-Year Fixed
6.98%
Source: Bankrate · October 16, 2026
VA 30-Year Fixed
7.13%
Source: Bankrate · October 16, 2026
Sources: Freddie Mac Primary Mortgage Market Survey (October 16, 2026); Bankrate National Mortgage Rate Survey (October 16, 2026).
View Primary Mortgage Market Survey →Freddie Mac figures are national weekly averages, not a borrower-specific rate quote. Actual rates and pricing vary by lender, loan program, borrower qualifications, property type, points, and market conditions.
September 17–October 16, 2026
Illustrative monthly housing payment at the $810,000 asking price, with 20% down and a 30-year fixed mortgage. Includes property taxes and HOA dues.
Estimated Total Monthly Payment, Excluding Homeowners Insurance
Y-axis: estimated total monthly payment in dollars, excluding homeowners insurance. Scale shown in full from $5,500 to $6,000; the vertical scale is not exaggerated.
Four-Week Summary
Starting Monthly Payment
$5,717
September 17 · 6.95%
Current Monthly Payment
$5,915
October 16 · 7.40%
Monthly Payment Increase
+$197
Based on 20% down at the $810,000 asking price. Payments include principal, interest, $729 monthly property taxes, and $699 monthly HOA dues. Homeowners insurance is excluded. Mortgage rates are illustrative national averages, not borrower-specific loan quotes.
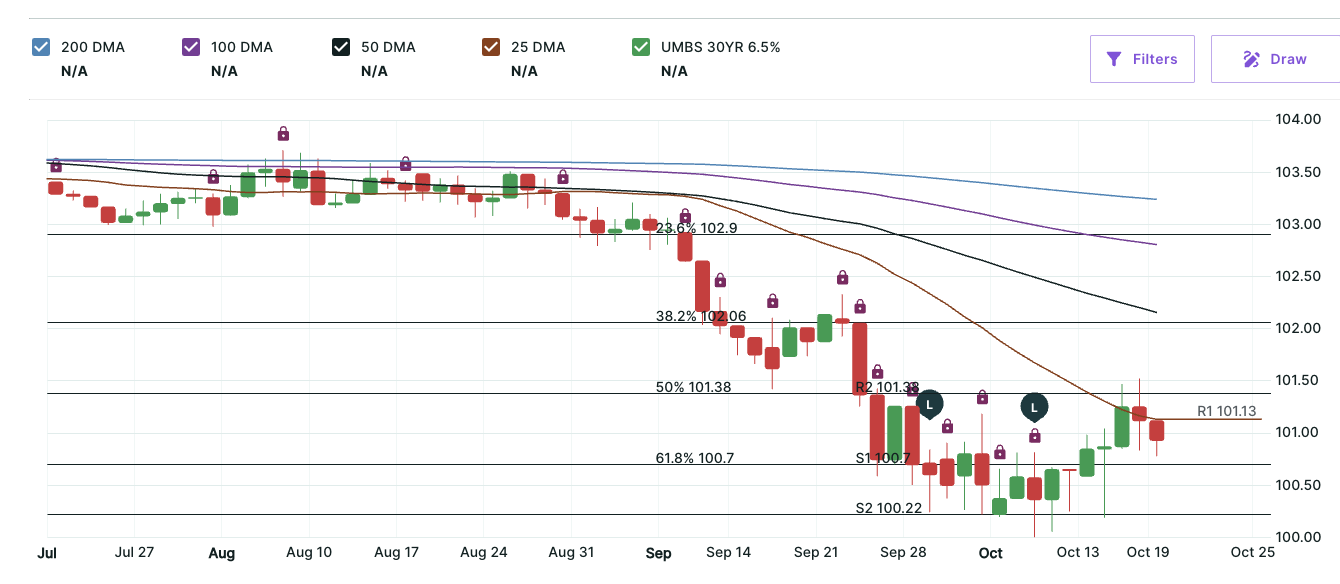
Mortgage-backed securities improved during the October 12–16 reporting week, gaining 47.7 basis points from the previous Friday's close. This improvement in mortgage-bond pricing did not translate into a corresponding decline in the mortgage interest-rate benchmarks reported for 8 Silverwood during the same period. For prospective buyers, monthly mortgage payments, HOA costs, and overall affordability remain important considerations.
MBS Market Chart
UNDERSTANDING THE MORTGAGE MARKET
You do not need to be a market expert, but understanding these two concepts helps explain why mortgage rates can change even when the headlines do not tell the whole story.
Mortgage-Backed Securities (MBS)
Mortgage loans are often pooled into securities that are bought and sold by investors. Changes in MBS pricing can influence the mortgage pricing lenders offer borrowers.
Weekly MBS Pricing Movement
Current Week
October 12–16, 2026
+47.7 bps
Previous Week
October 5–9, 2026
+14.0 bps
Current Friday Close
October 16, 2026
101.118
Previous Friday Close
October 9, 2026
100.641
MBS pricing improved by 47.7 basis points from the previous Friday's close, representing a stronger weekly performance than the preceding reporting period. Improvement in mortgage-backed securities pricing can influence mortgage pricing offered by lenders, but does not necessarily translate into an immediate or equivalent reduction in mortgage interest rates.
MBS basis-point movement reflects changes in mortgage-bond pricing. It does not mean mortgage rates changed by the same number of basis points or percentage points.
BASIS POINTS (BPS)
A basis point is a precise way to describe small financial changes. 1 basis point = 0.01 percentage point.
Source: MBS Highway · Updated October 16, 2026
View Detailed MBS Market Update →Mortgage-backed securities showed improvement during Week 4, gaining 47.7 basis points by Friday, October 16. However, the mortgage interest-rate benchmarks used in this report remained unchanged from the previous reporting period. For buyers evaluating 8 Silverwood, the monthly mortgage payment, HOA obligations, and overall affordability continue to influence purchasing decisions. The stronger MBS performance is a useful development to monitor, but it does not establish that borrowing costs have already decreased.
08 Interpretation
A combined view of buyer response, marketing performance, competing inventory, broader market conditions and financing — interpreted together rather than in isolation.
Week 4 Seller Update · October 12–18, 2026
Week 4 continued to reinforce a pattern we have been observing throughout this listing: 8 Silverwood is receiving meaningful market exposure, but that visibility has not translated into consistent buyer activity. The property received one private showing on October 15, with no additional buyer inquiries, follow-up conversations, or formal showing feedback during the reporting period. While that showing represents activity, the overall pace remains slow.
The property's condition and presentation remain strengths. 8 Silverwood shows well, and I do not see its physical condition as the primary challenge. What concerns me more is the economic equation buyers are evaluating before deciding whether to schedule a showing. Mortgage payments, HOA obligations, and the overall cost of ownership are influencing how buyers compare properties and determine what feels financially reasonable.
The broader market provides important perspective. At 32 days on market, 8 Silverwood remains below the estimated 161-day market time for its comparable Irvine attached-home segment. Meanwhile, competing properties such as 8 Fuchsia and 31 Meadowgrass have accumulated 81 and 93 days on market, respectively. To me, this reinforces that we are operating in a slower, more selective market where buyers have time to compare their options and are not feeling an immediate need to act.
Mortgage rates remained at our previously reported benchmarks through October 16, while mortgage-backed securities improved by 47.7 basis points during the week. That improvement is encouraging from a mortgage-market perspective, but it has not yet produced a corresponding reduction in the borrowing costs reflected in this report. Broader economic developments also contribute to an environment in which buyers may be more cautious about taking on substantial monthly housing obligations.
My interpretation is that the challenge is not simply getting buyers to see the property; it is giving them enough financial motivation to take the next step. The marketing has established visibility, but the level of showing activity tells us that visibility alone is not sufficient. We cannot determine every buyer's reasons from website statistics, and the October 15 showing did not produce feedback that would support a more specific conclusion.
As we move forward, I believe the distinction between a home that presents well and a home whose overall economics make sense to buyers is becoming increasingly important. 8 Silverwood remains an attractive, well-presented property, but today's market is asking buyers to make a more demanding financial decision. Understanding that difference is essential as we evaluate the property's position in the weeks ahead.
09 Our Focus This Week
Week 4 Seller Update · October 12–18, 2026
The focus is shifting toward improving the property's positioning and creating a more compelling reason for buyers to take the next step. Additional paid advertising remains paused pending a meaningful strategic change.
Prepare a review of potential pricing adjustments, seller concessions, or a combination of both. Evaluate how each option affects the seller's estimated net proceeds and the buyer's monthly payment or upfront costs. Discuss these alternatives with the seller before determining whether a change in market positioning is appropriate. If a strategy is approved, develop a distinct marketing campaign designed to communicate the new financial opportunity and encourage additional showings, meaningful agent conversations, and potential offers.
The existing Meta campaign was paused on October 12 following the Week 3 reporting period. Rather than continue spending solely to increase impressions, the next campaign will be considered alongside a meaningful change in the property's positioning and refreshed advertising creative.
Maintain targeted communication with agents who may have buyers suited to the property, prioritizing relevant opportunities over broad, repetitive promotional outreach.
Continue following up on prior showings, inquiries, and agent interactions where appropriate. Distinguish meaningful buyer interest from general exposure or casual engagement.
Continue appropriate conversations within personal and neighborhood networks, while identifying any new questions or objections that may help explain buyer response.
Monitor competing listings, including 8 Fuchsia and 31 Meadowgrass, for price adjustments, status changes, new competition, and other developments that could materially affect 8 Silverwood's market position.
Week 4 marks the transition from exposure to positioning.
8 Silverwood has established substantial marketing visibility, but buyer activity remains limited. The property presents well; the primary challenge appears to be the financial equation buyers face when comparing ownership costs and competing alternatives. The next step is to evaluate potential adjustments to pricing, seller concessions, or a combination of the two, together with their effects on buyer affordability and the seller's estimated net proceeds. Any resulting change should be supported by a deliberate marketing strategy rather than simply repeating the previous advertising campaign. No changes have been finalized. These options will be presented and discussed with the seller before implementation.
10 Archive
Week 1 · Launch Week

September 17–27, 2026
The listing entered the market with broad exposure across the MLS, property website, paid social, third-party portals, agent outreach, and the first round of buyer activity.
Week 2 · Weekly Update

September 28–October 4, 2026
The second week of marketing activity, including property exposure, buyer response, competitive market conditions, mortgage developments, and the strategy for the following week.
Week 3 · Weekly Update

October 5–11, 2026
The third week of marketing activity, including continued paid exposure, buyer response, competitive market conditions, mortgage developments, and the strategy for the following week.
No updates match your filter.
Scroll sideways
Prepared by
Rob Cole, Senior Broker Associate · The Cole Group at REAL Brokerage · DRE 01265803
Prepared exclusively as a seller advisory for 8 Silverwood.
Week 4 Weekly View video to be added