This is the Market Intelligence edition for the week of October 26, 2026: a sourced read of the late-October data for Irvine and Orange County, focused on what actually changed since the mid-October edition. The 30-year fixed rate eased to 7.32%, California's September sales report landed with a statewide median of $899,720, Orange County's pending sales fell to a five-year October low, and Irvine's attached-home inventory remains the most balanced part of the local picture.
Every figure below carries a named source and an as-of date, and nothing here is a forecast. The point of this edition is the shift in tone: after a stretch of climbing rates and fast-moving inventory, the late-October numbers describe a market that is cooling at the margin while staying expensive at the core.
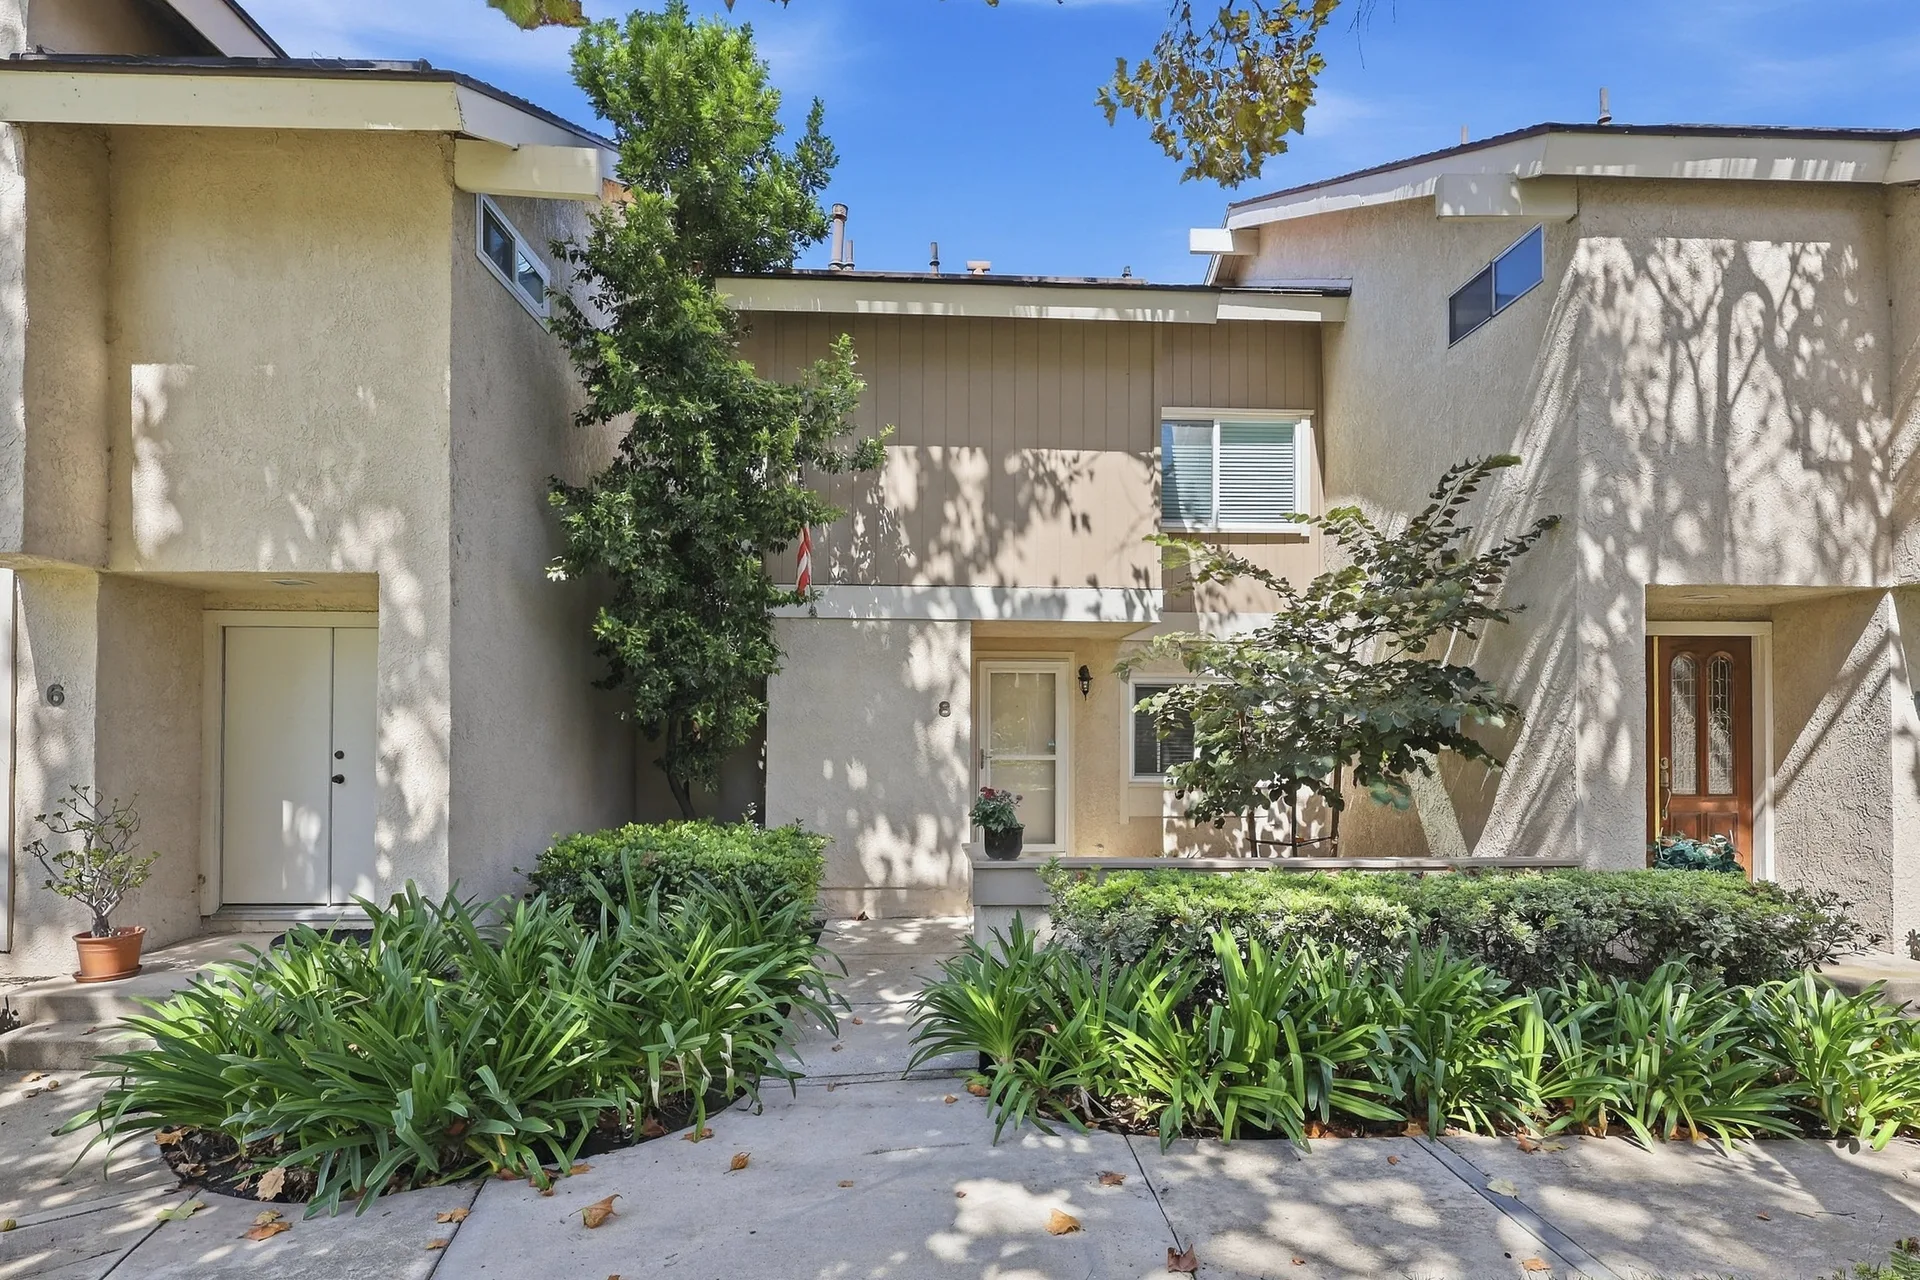
The short version is in the box below. The sections that follow walk through the mortgage-rate path, the September state and national reports, the county's pending-sales reading, and what all of it means for a buyer looking at an attached home like 8 Silverwood.
The one-line summary
The late-October picture is less hurried than it was a year ago: rates have come down one notch from their three-year high, California sales volume is running below last year, Orange County pending activity is at a five-year October low, and Irvine's attached inventory gives a condo or townhome buyer far more to compare than the single-family market does. None of that changes how expensive Irvine is. It changes how much time a buyer likely has to choose well.
Where the numbers come from
The same discipline that organized the mid-October edition applies here: every number is reported as figure, source, and as-of date together, because one median can answer several different questions depending on which slice of the market it covers.
Four families of sources carry this edition. Weekly mortgage rates come from the Freddie Mac Primary Mortgage Market Survey (PMMS), released every Thursday. Monthly state and national reports come from the California Association of Realtors (September data, released October 19, 2026) and the National Association of Realtors (September data, released October 13, 2026). County-level supply and demand readings come from the weekly OC Housing Market Report published by Orange County Real Estate Inc. on October 19, 2026, and from Orange County REALTORS' September market snapshot. Irvine closed-sale data comes from CRMLS records compiled by local brokerages, most recently for the 90-day period ending October 4, 2026.
One caution before the numbers: reports measure different things. Weekly pending counts, monthly medians, and quarterly closed-sale averages never line up exactly, and they should not be averaged together. The point of listing them side by side is to show direction, not to manufacture precision.
The rate turn: from 7.40% to 7.32%
The most market-moving number of the past week is the one that went down. According to the Freddie Mac Primary Mortgage Market Survey, the average 30-year fixed-rate mortgage measured 7.32% in the survey released October 22, 2026, down from 7.40% the week before, with the 15-year fixed rate averaging 6.68%.
To see what that decline means, it helps to see the path that led to it. Across the six most recent weekly surveys, the 30-year average measured:
- 6.95% on September 17, 2026
- 7.00% on September 24, 2026
- 7.28% on October 1, 2026
- 7.40% on October 8, 2026
- 7.40% on October 15, 2026, unchanged week over week
- 7.32% on October 22, 2026, down 0.08 points
That October 22 reading is the first weekly decline after a stretch of increases that carried the average from 6.95% in mid-September to 7.40%, its highest level in nearly three years, by early October. One weekly survey is not a trend, and it is worth noting that day-to-day conforming quotes can run above the PMMS weekly average; the county report referenced below described rates near 7.5% at the conforming level in mid-October. What the print does do is end the string of increases, which is the first piece of rate relief that buyers have seen in roughly a month.
For a buyer, the practical habit stays the same as it was in the mid-October edition: financing assumptions drive the monthly payment more than they did a year ago, so scenarios should be locked to the current rate at the moment of making an offer rather than to a remembered headline. The condo financing explainer in this journal covers the project-level questions an attached-home buyer may want to ask, and the Financing Perspectives area on the Market Intelligence page lets a buyer compare monthly scenarios side by side.
California in September: the C.A.R. report
The California Association of Realtors released its September sales and price report on October 19, 2026, and it shows volume running below last year with the median holding near its record range.
Existing single-family home sales statewide totaled 260,410 on a seasonally adjusted annualized rate, down 3.4% from August and 6.5% year over year. The statewide median price was $899,720, up 1.7% year over year from $884,390 and essentially flat month over month, down 0.2% from August's $901,420. Median time on market measured 29 days, and homes priced at a million dollars or more made up 35.9% of sales.
The attached segment, the product type that includes 8 Silverwood, is reported separately. The statewide condo and townhome median was $640,000 in September, unchanged month over month and down 1.5% year over year from $650,000, with condo and townhome sales down 2.7% month over month and 7.5% year over year. The C.A.R. release framed the pullback plainly: higher borrowing costs and affordability challenges continue to constrain buyer demand.
The national floor: NAR's September report
The National Association of Realtors published its September existing-home sales report on October 13, 2026. Nationally, existing home sales rose 1.5% from August to a seasonally adjusted annual rate of 3.99 million, down 2.2% year over year. The national median price rose 1.3% year over year to $417,500, the highest September median on record. Inventory stood at 1.60 million units, a 4.8-month supply, and the median home spent 33 days on market.
The West region, where Irvine sits, is the one part of the country where the median went the other way. West region sales rose 2.8% month over month to an annual rate of 730,000 but fell 5.2% year over year, and the region's median price was $613,600, down 0.3% from September 2025, the only region with a year-over-year decline. In plain terms: national supply is expanding while the West's price level, including California's, is holding near record levels rather than rising further.
Orange County: pending sales at a five-year October low
The most telling county-level signal came from the weekly OC Housing Market Report published by Orange County Real Estate Inc. on October 19, 2026, headlined "Pending Sales Hit a Five Year October Low." Pending and under-contract listings countywide fell to 1,573, the fourth consecutive weekly decline and the lowest October reading in at least five years. The report attributed the early slowdown to mortgage rates near 7.5% at the conforming level and broader economic uncertainty, and said the autumn cooldown had arrived earlier than usual this year.
Price and inventory context from the same report: the county's single-family median list price held at $1,699,900, with a condo and townhome list median of $824,900, and the most recent seven-day closed condo median measured $770,000. The prior week's edition noted the single-family list median slipping below $1.7 million for the first time before settling back. Countywide, September market reports from Realatrends and Wire Associates counted roughly 4,900 to 5,100 active listings, about 3.1 months of supply and the highest inventory level since 2019, with the actual count varying by methodology.
Orange County REALTORS' September market snapshot adds the year-over-year price split that matters for this site: the detached-home median rose 5.6% year over year while the attached-home median fell 8.0% year over year, with detached sales down 2.7%. In other words, the softening that shows up in the attached segment is measurable and current, which is precisely the segment a buyer at 8 Silverwood is shopping.
Irvine: attached inventory and the pace of sales
Irvine's most recent closed-sale reading is unchanged from the mid-October edition because no newer closed dataset has published since then: the CRMLS-based 90-day median through October 4, 2026 was $1,450,000 across 538 sales, with a trailing 12-month median of $1,510,000, down 3.6% year over year. Redfin's own Irvine page, covering the three months ending September 2026, put the median near $1,449,310, down 6.5% year over year, with homes spending about 61 days on market.
What is new since the mid-October edition is the activity picture around those price levels, and it is the picture that matters most to an attached-home buyer. The October 2026 county report counted about 417 active condo and townhome listings in Irvine against roughly 305 active single-family listings, with the condo and townhome median asking price near $1,296,800 and attached listings sitting a median of roughly 40 to 43 days on market. A Keller Williams Irvine team's early-October market note counted Irvine pending contracts per week falling from about 40 early in the year to about 17 by early October, a pace reading rather than a price reading, and one that echoes the countywide pending trend.
The village context from the mid-October edition still frames the immediate comparison: in Woodbridge, where 8 Silverwood sits in the Deerfield area, the 90-day median closed price was $1,150,000 at about $807 per square foot, with a median 20 days on market and closings near 98.9% of the final asking price, per CRMLS data compiled by HomesForSaleInIrvine.
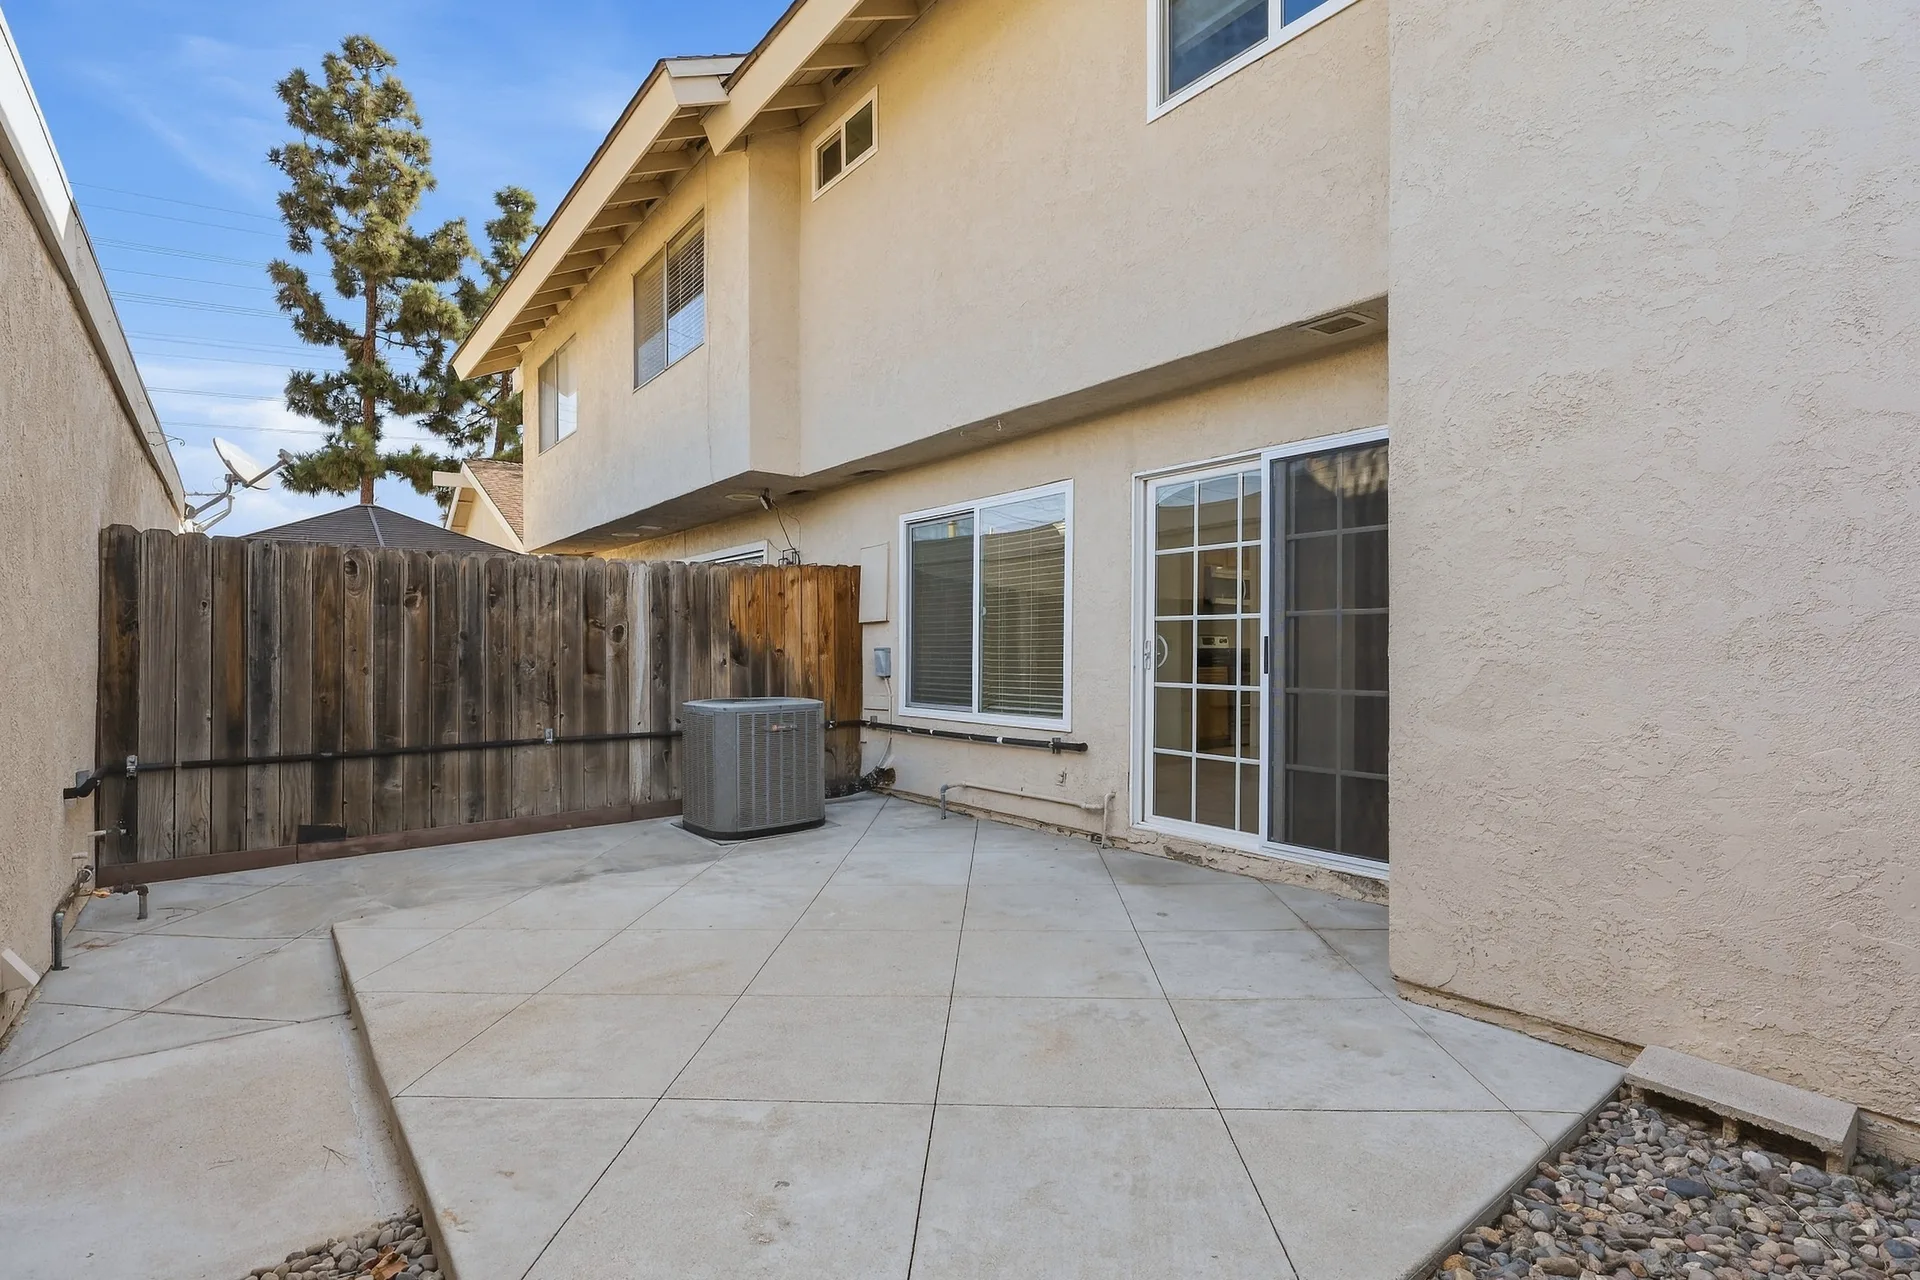
Where does 8 Silverwood sit inside these numbers? The home is listed at $810,000 for about 1,068 square feet, roughly $758 per square foot. That asking price lands just below the county's condo and townhome median list price of $824,900, about $40,000 above the most recent seven-day closed condo median of $770,000, and materially below Irvine's condo and townhome median asking price of about $1,296,800, which reflects the home's smaller footprint and its established village setting rather than any data oddity. It also sits above the statewide condo and townhome median of $640,000, consistent with Irvine's premium location within California. The comparison set on the Market Intelligence page shows how this position holds up against specific nearby listings month to month.
What this means for buyers looking at attached homes in Irvine
Put together, the late-October data describes an attached market that has more inventory, a slower pace of pending activity, and a slightly softer year-over-year median than the market of a year ago, all framed inside a city where prices remain very high by any national standard.
Three practical notes follow. First, the balance that was already visible in attached inventory in mid-October has, if anything, widened: roughly 417 active condo and townhome listings in Irvine give a buyer real alternatives to compare before choosing, and pending-pace data suggests decisions are taking longer rather than being forced. Second, rate relief of eight basis points does not change the financing math in a meaningful way on its own, so diligence should stay on current-rate scenarios, on the HOA and association file, and on the project-level questions that attach to condo lending. Third, every figure here is point-in-time: inventory changes weekly, one rate print is not a trend, and the September reports land a month late by design. The right move is to verify the current numbers at the moment of making an offer.
For attached-home buyers specifically, two journal posts carry the documents and financing detail worth reading beside this edition: the SB 326 and the HOA file guide covers the inspection report attached-home sellers must now include in resale disclosures, and the condo financing explainer walks through reserves, insurance, and project eligibility. The Neighborhood guide covers how the Deerfield area actually lives, which no dataset does.
The honest read of this edition: Irvine and Orange County remain expensive markets, and nothing in the late-October data is a prediction of where prices go next. What the data does show is that the attached segment around 8 Silverwood has become a market where a buyer can compare, verify, and decide on a normal timetable, which is exactly what a balanced market is supposed to allow.
Sources and data notes
Every figure in this article is attributed to a named source with an as-of date. The primary sources are:
- Freddie Mac, Primary Mortgage Market Survey, October 22, 2026, and news release "Mortgage Rates Decrease to 7.32%." freddiemac.com/pmms
- California Association of Realtors, "California home sales pull back in September," September 2026 report, released October 19, 2026. car.org
- National Association of Realtors, "Existing-Home Sales Increased 1.5% in September, According to NAR Report," released October 13, 2026. nar.realtor
- Orange County Real Estate Inc., OC Housing Market Report, weekly edition of October 19, 2026. ocrealestateinc.com
- Orange County REALTORS, OC Market Snapshot: September 2026. ocrealtors.org
- HomesForSaleInIrvine, "Irvine Housing Market Data: Prices, Days on Market, by Village," CRMLS closed-sales data through October 4, 2026. homesforsaleinirvine.com
- Redfin, Irvine, CA housing market page, three months ending September 2026. redfin.com
- Irene & Ricky Zhang, Keller Williams Irvine, "Overpriced Irvine Listing? Low Inventory Won't Save It," early-October 2026 market note. ireneandricky.com
- Realatrends, "Orange County Market Report: September 2026." realatrends.com
- Wire Associates, "SoCal Market Report, September 2026." wireassociates.com
Data notes: sources measure differently, so figures from different reports are not directly comparable, and all figures are point-in-time. The mid-October market edition of this journal is linked here for comparison. Bedroom, bathroom, and square footage figures for 8 Silverwood are from public listing data for MLS NP26199481 and should be independently verified. This article is market context, not an appraisal, a forecast, or a representation of future value.
Explore More of 8 Silverwood
Continue into Market Intelligence, the Neighborhood guide, Property Resources, or the photo gallery for additional property information, buyer resources, and local context.